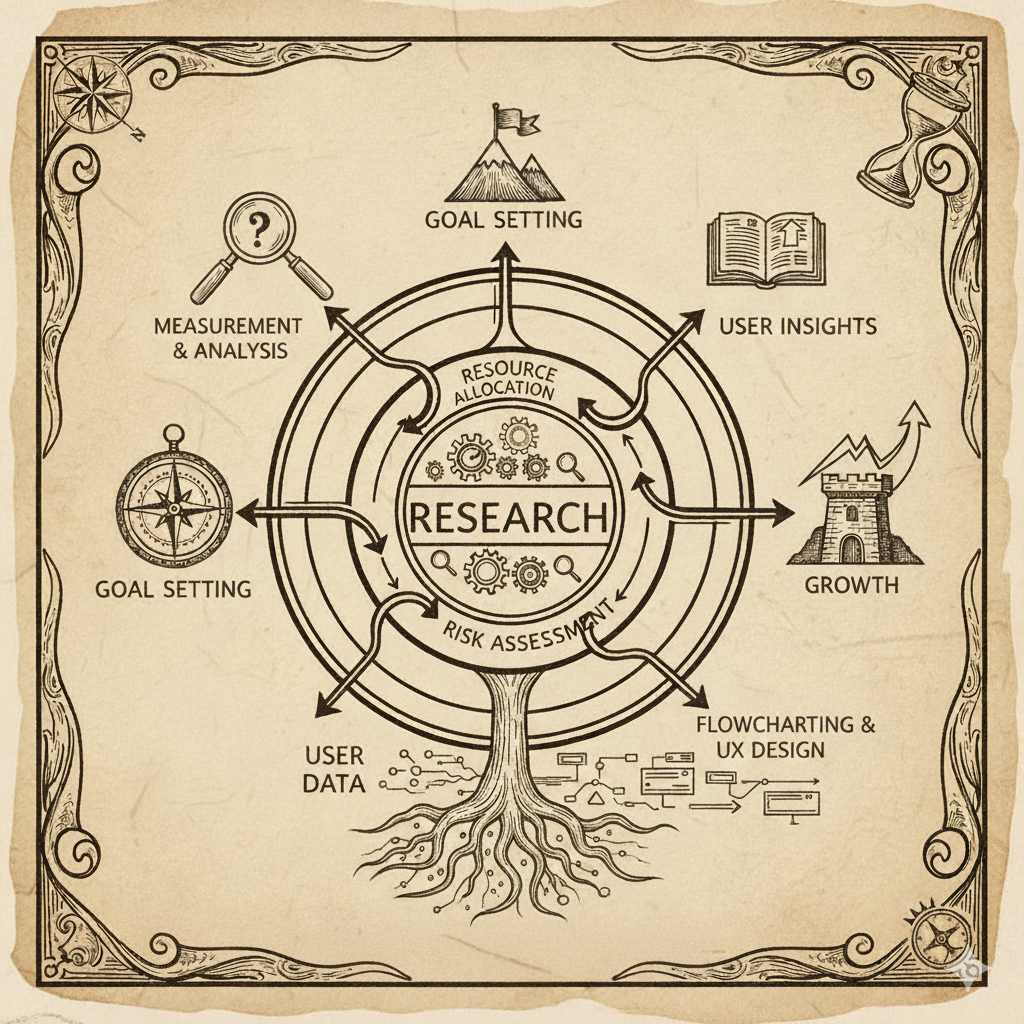
In working on archiver and in exploring the landscape changes of ‘agentic systems’ it feels like we are moving past a kind of golden age of design. It’s a shift that in some ways is the antithesis of the shifts brought by mobile and the ‘consumerization’ of enterprise in the 2010’s.
The golden Age?
2010ish to 2025 marked a golden age for visual design for screens. Starting around 2010, many businesses invested in far more thoughtful visual and interaction design. The standardization of high resolution screens, typography as a service, and new web standards allowed precise visual control. In 2006, one of my enterprise clients made 100mm ARR and used me as sole part-time designer for all products. By 2015, their revenue was flat but they felt the need for a 3 person design team to maintain a higher standard of polish. When moving out of consulting back to corporate in 2017, I worked in two companies who struggled to maintain 30mm ARR but staffed 10 person design groups.
For many of these companies, for a lot of reasons, it was important to visually style the controls, navigation etc in much the same way as automotive stylists do for interiors. That gave birth to larger departments and to design systems and process. If you are unfamiliar with design systems, imagine a fusion of style guides, template libraries, and branding systems intended to make sure every designer in these big departments created consistent output.
I observe companies invest in design when design drives sales (thru a perception of professionalism or social conformity) renewals (via ease of use), or referrals (via utility). For design to drive sales, some human needs to see it and feel it.
Many fellow designers look at tools like vercel, figmas ai tooling, magic patterns. Then they think ’there goes our value.’ That misses the real dilemma- in practice tools like magic patterns help give voice to ideas that PMs and Engineers have. They promote great discussion, and help develop ideas. A bigger issue comes from how large design ‘brigades’ and design systems de-emphasized development of taste or judgement for consistency of production.
Fewer screens, fewer designers.
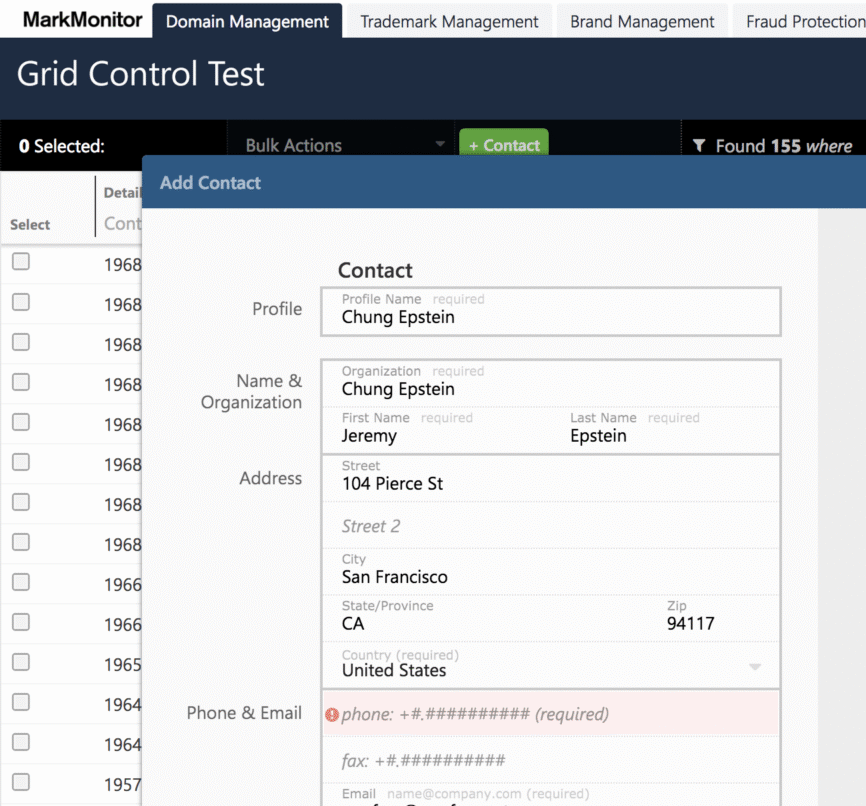
Agentic systems have the potential to vastly reduce the overall number of human-computer interactions which require a screen or physical interface, and lessen the sales value and budget given to design of interfaces in many business-to-business companies. Building archiver gave me a front row seat to agentic software engineering, the most mature of these uses. My greatest frustrations came from where I had to jump to different SaaS user interfaces, just to pull data to feed to Claude to help diagnose issues. Wearing an engineering hat- it would be so much nicer if the coding agent simply interacted with these services (more mcps!) in the same headless and seamless way it can on my local dev box. OpenClaw is another example of where this is going: headless access to email, calendar, social media posting etc… Tools like OpenClaw reduce the number screens vs. machine interfaces. The automation from these systems may reduce the need for human centered screens in enterprise by 10x. Fewer screens mean fewer designers, fewer design managers needed for each dollar of revenue.
We’ve seen this before
This disruption reminds me of the first big shifts I saw as a designer. From the mid 1990’s thru 2000 two similar shifts occurred: Mid-career designers either adapted using computers for print or saw their careers cut short. A second transform happened in the dot-com era when much of the bread-and-butter work for print design and advertising collapsed in favor of web presence.
One other danger which I already see is the temptation for designer to drive novelty at the expense of usability. This is all to common in automotive interior design, particularly infotainment, and I see it creeping in to general screen design.
We are not there yet; there is still a mindset where each product manager(pm) pairs with a designer. But as a profession, designers would be remiss to see the winds change, just like they did 26 years ago.