Category: Design

  • Protected: Research Strategy for BenchSci – (AI for pharma R&D)

    This content is password protected. To view it please enter your password below:

  • AI for User Research @ BenchSci: Tactics that worked.

    AI for User Research @ BenchSci: Tactics that worked.

    TLDR: For our use: maybe 5% more speed with acceptable quality. Biggest benefit: coding for spreadsheets / data analysis.

    Context –

    until recently I ran user research at * (check my linked in)  and mentored designers and product managers. We put heavy emphasis on effective decision support for product strategy (building the right things) in addition to the usual kinds of design/PM support. I’ll try to limit this to user research and not general productivity. Doctrinally we followed the principles of continuous discovery / validation with a small user base. 

    Rules of the road for the Research team

    AI helps if it accelerates some balance of speed or quality while respecting the rules.

    • If you bring data to stakeholders too late, it’s not helpful.
    • If the data you bring is misleading, its not helpful.
    • numbers speak powerfully, but avoid misleading quantification.
    • avoid jargon- always assume you speak to a design/product outsider with no interest in the finer points of CIs and statistical significance.
    • stakeholders only tend to check work when the conclusions are inconvenient and trust it when they agree with it. Have your homework ready.

    We Explored AI for

    • rapid prototyping
    • synthetic users
    • data analysis
    • automating review/extraction from recorded calls
    • LLM as judge for design evaluation
    • writing for UX
    • general writing
    • perf reviews
    • making historical research accessible.

    Not Explored

    We did not explore uses where we already had reliable and effective automation or absolutely required human oversight (recruiting /compensation pipeline)

    Where LLMs really helped: 

    1. Writing for UX. Designers are often tasked with key bits of text in the UI. As a group, designers do not write well. This was a big win for new products/features.
    2. For us, 1 in 10 studies demanded low visual fidelity, highly interactive prototypes, with domain accurate content. Figma sucks at that, particularly tabular data and data visualizations. Vibe coding really helped that. This benefited new / early ideas more than shipped features in refinement/optimization. When it made the difference, it really made a difference.
    3. Spreadsheet like a pro. 
      There was always some project that required fusing different data, even for things like survey data fused to SFDC outputs. Advanced spreadsheet work is a kind of coding. The research team can do a little stats, we’re perceptive observers, and good interviewers. Not everyone on team can own spreadsheets like a financial analyst. This helped a lot with a small number of critical projects.
    4. Tone on general comms- 
      Used ‘LLM as judge’ on communications. For critical written company communications and things like performance reviews, LLMs definitely helped avoid gotchas— they didn’t improve speed or productivity but made sure poorly chosen words didn’t trigger morale or cause defensiveness. 
    5. Making historical research accessible 
      We tried a few approaches to this, starting with adding research reports to a notebookLM. In the end we found more consistent results by translating research reports to markdown and bullet pointing them for LLM. Getting the organization to go and ask was an institutional barrier we worked to overcome: PMs still preferred to use the researcher on team as a human encyclopedia in meetings. Senior leaders, when they chose to ask approached me directly.

    Shows some promise, but not there for us

    While applying just a foundation model might not work… there is much to try with hybrid approaches.

    1. Synthetic users for ‘attitudinal/behavioral’ questions
       (i.e. ‘ what are your biggest challenges with ‘x’ )Again, this is a mixed bag depending on how much underlying high quality data we had. It felt like we never got to critical mass – it works great when say a newly hired PM or designer asks an ‘old’ question where established data exists.  We used a pseudo-RAG approach (.md files accessed via cursor prompt against different models) It wasn’t as good as our control (‘ask a researcher thru slack’) in terms of quality, but response time was better.
    2. Getting insight from interview transcripts. Ideally automated insight.
      This is another one we really want to work, especially in an automated way. We had a lot of recorded conversations with customers well beyond research sessions. Both the services team and ours would love to get data off of them without the time cost of manual review. So we wrote some custom prompts as well as using dovetail’s evolving toolset. We saw improvement, but not enough maturity to save time: Commonly extracted data confused speakers (customer vs us), generalized away details, and depended on high quality transcripts. Bio research is a jargon heavy, with researchers from all over the world who have different command of English. It wouldn’t save us enough time while delivering accurate insight.

    Unhelpful with state of art in 2025

    We saw a good chance outputs may drive confidently bad decisions. Not confident that base foundational models will focus on these – it may require custom / external evaluators.

    1. LLM as heuristic judge for basic usability issues. 
      We really wanted this to work. This is a subcategory for synthetic users. In early designs you often find a lot of issues with ‘basics,’ well established heuristics.  We tried a mix of custom prompts around this , submitting single screens. The hope was to increase speed for designs in a similar way to unmoderated testing but with somewhat better precision and a lot more efficiency. The LLM tended to miss on visual and behavioral, focusing on words in the screens or screen images. For the big models this is a small dollar value problem, but feels like it needs big model energy to solve.
        
    2. General writing of reports for humans
      Thru trial and error we found the most effective reports for our company tend to be highly visual with very few words (also memes), accompanied by a short slack summary.  LLMs are great writers, but… summaries tended to miss the points we were trying to make.
    3. Study design -. In general it didn’t save time or improve quality.
    4. Agentic Interface Design – Compared to 20 years ago a lot of design today is not that experimental.  this might actually be both possible and effective with the right models and really mature  UX component systems to preserve visual and behavioral consistency. (Shopify has these building blocks, but others not so much) its one area where non-determinism in models could be a huge plus for ideation. I do think it requires augmenting foundational models with  models trained specifically around design concerns.I don’t think figma or canva will get there because at heart they still operate on well grouped, partially parameterized vector drawings. Not the way and engineered component works, or with knowledge of core cognitive psychology. 
    5. Generating personas or foundational research with just a foundation model search.
       When asking foundational models we got surprisingly accurate reads on how preclinical pharmaceutical research works at a high level. When asking models to create personas, the form was amazing but the data was only between 50% and 85% accurate when compared to our data. I would have big concerns that PMs and Designers using this data would make consistently bad decisions with confidence.

    One final thought: Don’t let AI isolate you from customers.

    Anytime you put a layer between PMs and users is a fail. Face to face interviews drive alignment far more than any research report. In my opinion listening to and observing real users and customers directly and frequently makes the biggest difference in product quality and fit. The more isolated PMs, execs, and designers are from customers, the worse their decisions become. Many AI tools for research position themselves as a timesaver in automating every thing from study design to final reports. They typically position to the haerried PM or the research manager.

    As it stands execs don’t often interact with customers on. Bad PMs certainly don’t.

    Apologies for the long rant, 
    Jeremy

  • Understanding Reliability at TopHat

    Understanding Reliability at TopHat

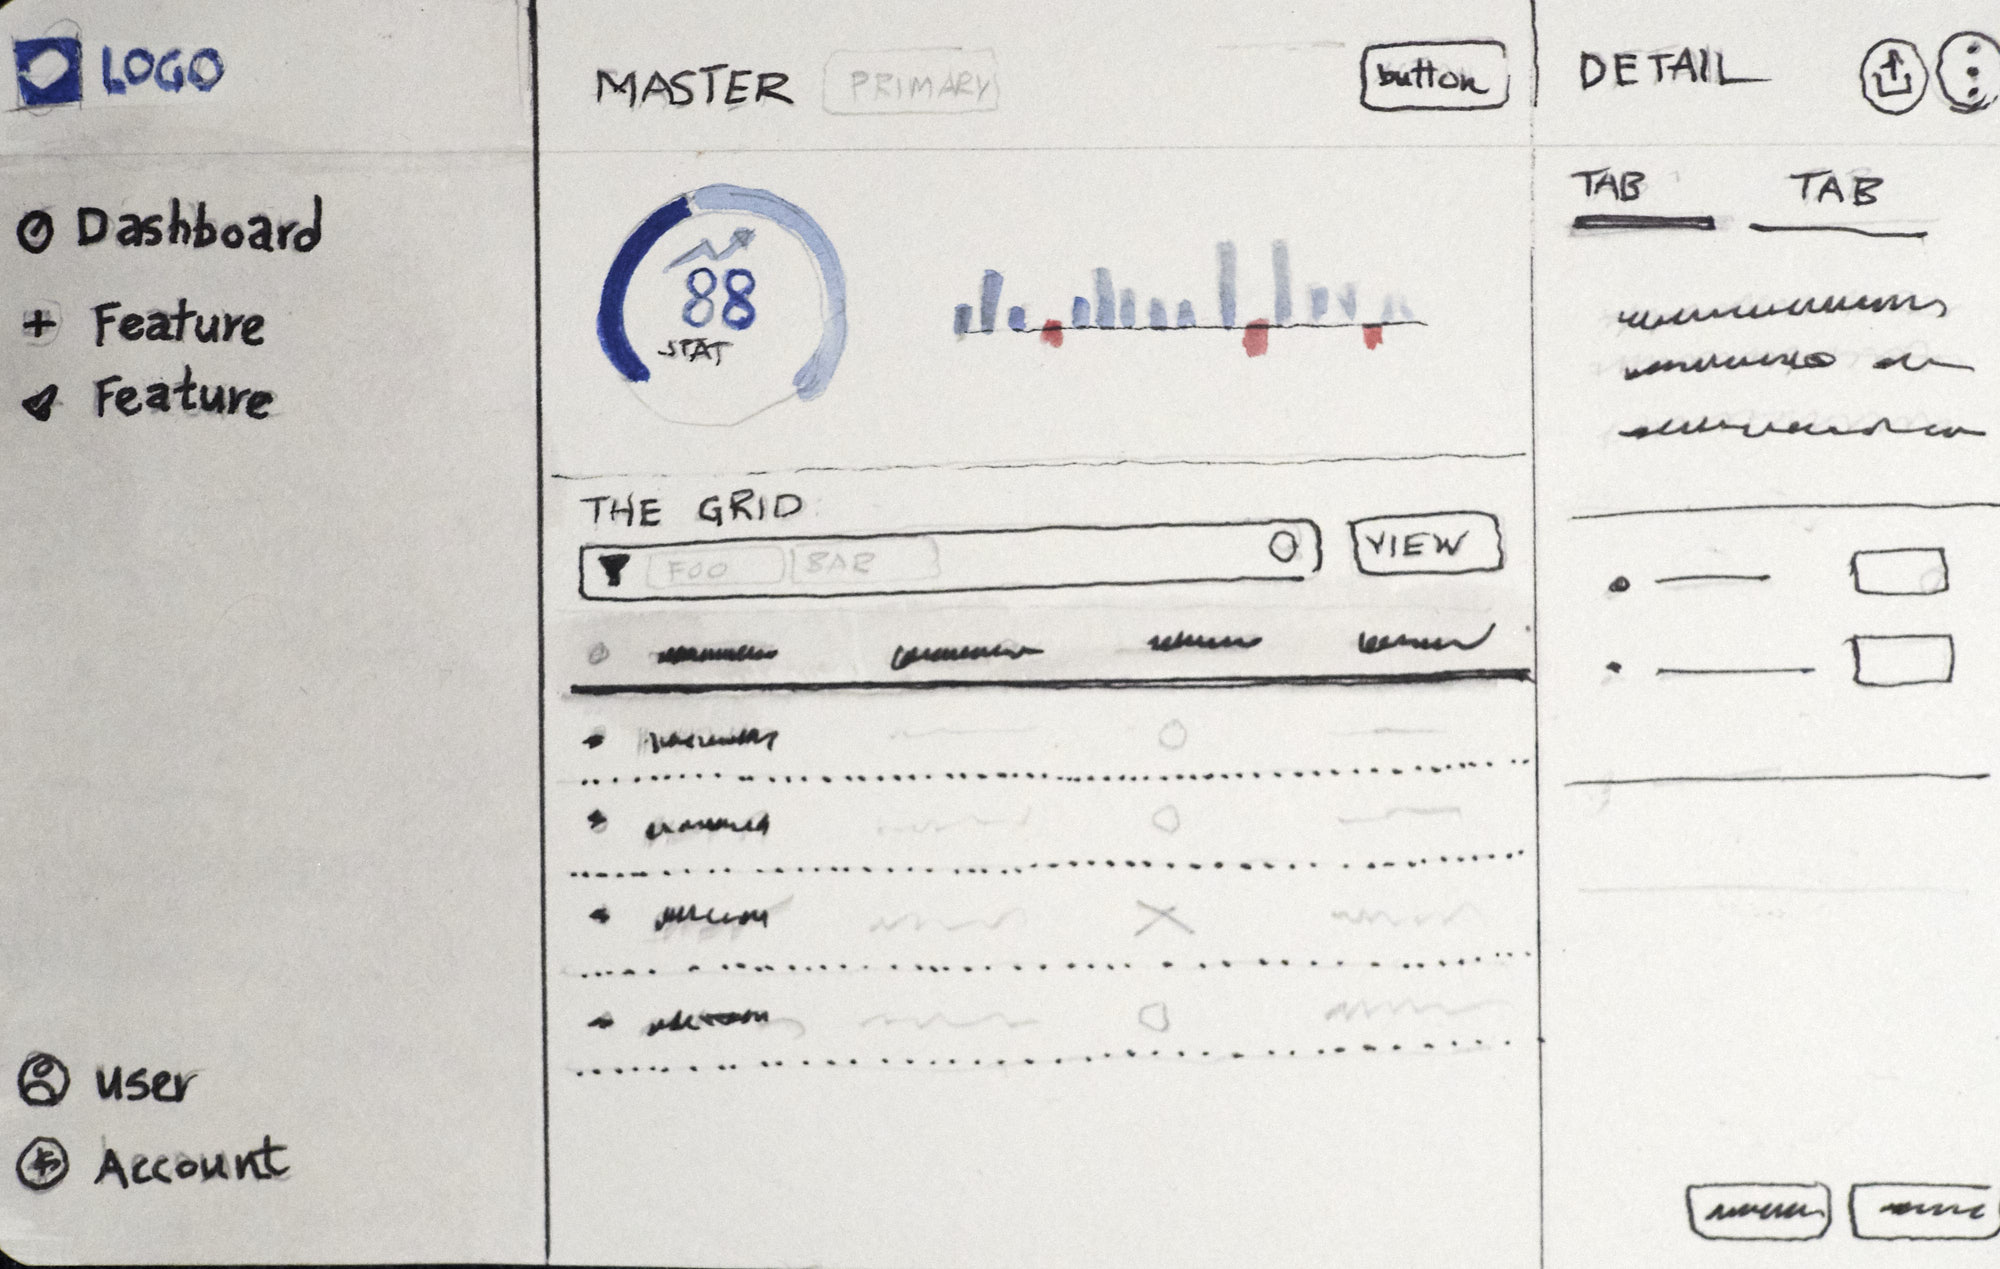
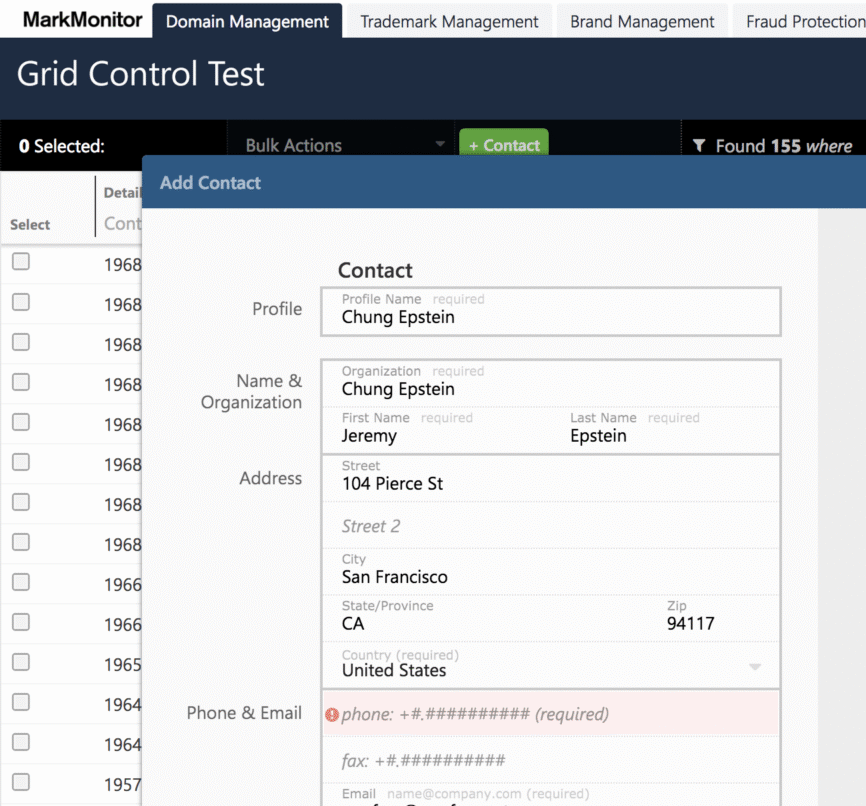
    that indecipherable prompt on the screen above is a teacher failing to connect

    The project which got me the job at TopHat concerned perception of reliability by teachers and students using the platform. Churn rates were very high in classrooms. No obvious patterns showed in metrics, telemetry, course construction, type of course, etc… Some in the company dismissed reliability concerns as subjective or perceptual, manageable without fixing.

    Topwho?

    TopHat provides a gamified experience to improve student learning in the lecture hall. Students answer timed questions on their mobile or laptop when posed by the professor. This works when timing is perfect. The team heard student and teacher complaints about reliability but nothing correlated to consistently collected in-app data. Additionally students may be unreliable reporters when grades were at stake. They might skip class then blame the software.

    In class points counted for grades or attendance.

    The question: Is reliability mostly perceptual, or is there a cause we can fix in product or course design?

    Mixed methods combining fieldwork, in-app analytics, and semi-structured interviews. An Ideal outcome answers the big question and provides guidance to teams:

    • A way to predict likely reliability so we can deploy support when needed
    • A way to assess the severity or likelihood of churn with a focus on larger, more lucrative classrooms.
    • Determine if this was perception or technical.

    Protocol –

    Start with 10 ‘bad’ and 10 ‘good’ classrooms . Good classrooms rarely report issues. In bad classrooms, professors threaten to churn unless something changes. This first set of 20 helps form hypothesis to measure by metric and confirm with further onsite evaluation.

    Include a diversity of classes, and make detailed observations:

    • Subject, material,
    • Class size,
    • Nature of reliability claims,
    • Student response speed in app,
    • Position of students in lecture hall,
    • observation of distracted students,
    • speed tests,
    • utilized capacity of lecture space.
    • Identify a metric to help proactively identify low reliability.

    Reliability was technical, challenging to measure directly in-app

    Reliability correlated to Wi-Fi saturation and configuration. Poor configuration was made worse by the inefficient way slides were sent to student devices: Like most startups, Top hat engineered for fast feature development, not optimizing efficiency or speed over limited bandwidth. Large lecture halls sport many WiFi antennas to handle the load of connections. Configuration issues on the part of campus IT saturated some antennas and left others unused. Asking a question or moving forward in a slide delivered a hefty, synchronous data payload to each student laptop, overwhelming the network and causing delays. This meant missed questions, particularly on lectures with large numbers or image-intensive slides which could saturate the network.

    Reliability of attendance presented a different technical challenge: students could participate over browser or phone app, but laptops lack the precision of GPS receivers – we measured them at 92% accurate, where phones did better than 98%. More than 2 mis-marked students in a 100 student lecture leads to churn within 6 lectures.

    Students were generally attentive and honest. We sat in the back and observed screens in these lectures. At the time we observed a ‘distracted’ rate of around 10% across the board. Students were very good at task switching to answer a question when it came up. We saw very few examples of student dishonesty. We saw more examples where a question wouldn’t activate until only a few seconds were left to respond.

    Finding actionable leading indicators

    In student and professor interviews, and direct classroom observation the common complaint related to latency- questions didn’t appear on a student device until after the window for answering questions closed. We confirmed this with direct observation in lecture halls.

    Direct measurement proved difficult. When we talk about measuring click streams, its within the same person, same device, same app or tab. In this case the team needed to measure the time elapsed from when a professor clicked to pose a timed question to when the question activated on each students device. Many factors complicate this direct measurement.

    Poor speed test results generally correlated to problem classes. These were measured manually as opposed to automatically in-app.

    There was no correlation to class size, number of questions, lecture hall utilization or student NPS scores or comments.

    We saw medium correlation to the number of lecture slides.

    There was a very strong association to post-lecture grade book adjustments and churn. If a reliability issue meant more work for a professor, it spelled trouble. When it was just complaints, it mattered much less.

    Impact: Reliability was not subjective or a result of student dishonesty.

    We could identify courses of concern in time to intervene: they had more than 4 grade book correction per 100 students within the first two lectures, occurred in a lecture hall with known bad WiFi, or existed where majority of students used the web app for attendance.

    Reliability became a business concern when professors took on extra work to correct grade books. With an average of 12 lectures per course, professors would churn due to the extra work.

    Actionable improvements: The team moved to reduce the size of slides to students. This provided a modest benefit.

    When we identified a possible ‘poor classroom’ we could work with campus IT to resolve.

    We introduced a regular practice of bringing engineers and product managers to class. This paid dividends later on in terms of engineering velocity and empathy.

    As a result of this, TopHat established a full-time research team which regularly and consistently visited classrooms to measure everything from how projector resolution and ambient light affected questions to how frequency and randomness in asking questions affected student attention.

  • Wanna make the journey stick? Use the finest learning instrument.

    Wanna make the journey stick? Use the finest learning instrument.

    Activity trumps Lecture, every time.

    Cross functional teams often struggle to have a shared sense of a problem space. Designers and researchers use frameworks like user journeys and personas to solve for this. Teams praise the praise the presentation then promptly forget it. Complicating this, design /research teams constantly tinker and refine. To outsiders it just makes things worse.

    So… Enter the board game

    The game was cooked up in a frantic 5 days.

    Specifically this game is for a company who sells to users and buyers involved in the first stages of pre-clinical drug discovery. The game represents the content of journeys and personas in a way that lets a team feel and remember thru experience, rather than focus on ‘false details.’ Games can backtrack and circle where journeys tend to make everything a line.

    How to Play: For the game, 2-4 teams of 3-4 players compete to prove the viability of a target for creating a new medicine (the underlying journey). Each team represents a pharma. Players choose different roles with different special powers(Personas). The game completes when one team reaches a final square after successfully solving a “invitro” and an “invivo” experimental puzzle. Game-play combines elements of Chutes and Ladders type games with “Clue.” We typically play for about 45 minutes, followed by discussion.

    The game arose out of a meta-analysis of existing research, supplementary interviews, and document analysis for the purpose of evaluating the likely market perception and pitfalls of a major new offering. I.e. is the offering a hit or miss, and what might they do to move it closer to hit. I also did the full workup of more traditional personas and journeys.

    Did it work?

    Users in and out of design retained knowledge about stages and pain points better.

    It also helped researchers open up to try different ways to communicate – knowing we have to try and fail if we are to speak with an effective voice.

    The cross functional teams of engineers, product managers, staff scientists, and design worked better together.

    Engineers better understood the value of some of the big engineering tickets. They also participated more in the life of the product.

    Three years later, people still approached me with memories of when they played the game.

    — Jeremy

  • Quick Release Urban Bike Bag For a Moulton

    Quick Release Urban Bike Bag For a Moulton

    Follow thru and experimentation is the only way to design technical projects

    Frame attached bags for city bikes need to solve for technical and practical problems.

    Carried loads should remain undisturbed, even when cornering, hitting bumps, tram tracks, or emergency braking. Cyclists need to be able to quickly detach the bag and its contents off the bike to leave nothing tempting for thieves. Bags should resist weather and abrasion while staying reasonably light.

    As a commuter with errands, I had a few more rerquirements: THe bag should be trim enough to carry into a musuem with a laptop and sketchbook, but with the expansion capactiy to bring groceries or takeout home when Priss texted asking forr bread and milk.

    Why create something new?

    Why not panniers or a basket? Well, neither fit easily to my bike. Panniers have good technical attributes such as center fo gravity and quick release, but poor practicality when carrying bulk items such as our ‘friday sushi’ upright. Panniers also tend to carry quick release harware that can snag on things. Its always better to balance pannier loads by having 2 but this is less convieineint for carrying into buildings. Retrofit baskets tend to work well for carrying but can affect handling if loaded. They still need bags. And why not pbackpacks? Its not a great idea for my back.

    Early Idea, First try

    This was my first bag design, and a with first of everything, somethings just always go wrong.

    Sizing was done by fitting a cardboard maquette, then doing tech drawings. For attachement, I thought the bag could quick secure by hooking under the back platform then anchor to a stap attched to the seat tube. The bag would slip between bars on either side of the platform to provide three points of connection and lateral stabilty. A laptop pocket on the bottom provides additional stability as the laptop and padding provide dimensional support. two standard buckles on either side allowed me to attach a shoulder strap. An expanadble compartment coverted the bag from a laptop bag to a duffel large enough for a full grocery load, bulky takeout, or a weekend trip.

    Tough Traveler in my hometown of schectady did the cutting and sewing of the prototype.

    Fast forawrd a few weeks and a prototype shipped to me.

    First fail:

    Just before fabrication started, I looked to see how close the template came to my cycling shoes when pedalling, by pedalling stationary and photographing the overlap. Turns out that more than 1/2 inch of overhang with the plaform back results in a heel strike. A quick adjustment fixed this and drove the next issue.

    The follow on fail

    IN adjusting the bag shape, there wasn’t enough lateral support from the foam reinforced cordura. The bag would swing wildly by the seatpost with no provocation.

    A solution from unexpected places:

    In experimenting with by wrapping the shoulder strap around the platform back, I could stabilize the bag.

    The fix idea came when we had a cushion fixed for a smooth surface wooden bench in our place: upholsterers commonly glue or staple high friction fabric to slick surfaces to keep cushions from moving. I created a paper template for a matching sleeve on the platform back also made of cordura, with matching buckles to snap the bag into– the friction of the fabric and buckles kept things in place. The fabricated sleeve returned a couple weeks later

    Its been a couple of years and the bag proved itself- with groceries, commuting, short trips, bike-packing.